
You've reached the Virginia Cooperative Extension Newsletter Archive. These files cover more than ten years of newsletters posted on our old website (through April/May 2009), and are provided for historical purposes only. As such, they may contain out-of-date references and broken links.
To see our latest newsletters and current information, visit our website at http://www.ext.vt.edu/news/.
Newsletter Archive index: http://sites.ext.vt.edu/newsletter-archive/
Amy Booth and Charles Hagedorn
Research Associate and Extension Water Quality Specialist, respectively, CSES Department
 Introduction
Fecal bacteria are the major cause of impairments in Virginia's waterways according to the Virginia Department of Environmental Quality (DEQ) (6). Fecal coliform, specifically Escherichia coli (E. coli, a type of fecal coliform), is used as an indicator organism. The presence of fecal coliforms could indicate the presence of pathogens and an increased risk of disease. Fecal coliforms, E. coli, and other intestinal bacteria are present in warm-blooded animals and humans, as well as some cold-blooded reptiles and most birds (1,4). The presence of human contamination can mean a higher risk for viral diseases like polio and hepatitis. Animal contamination could mean a higher risk for giardiasis (backpacker's disease), cryptosporidiosis and salomnellosis. Bacterial source tracking studies can aid communities in making decisions about public safety and exposure to contaminated water. Knowing the sources of fecal pollution is fundamental to the total maximum daily load (TMDL) program currently being implemented in Virginia and nation-wide. A simple count of fecal coliforms is not sufficient to determine the contribution of sources to the pollution or which best management practices (BMPs) would bring impaired stream segments into compliance, especially in a mixed-use watershed. Bacterial source tracking is a tool that must guide this process.
Several bacterial source tracking (BST) methods are under development for use in determining sources of fecal pollution in a contaminated water body. Each method is built on the fact that bacteria (or viruses) from different sources of fecal pollution can be distinguished from other sources of fecal matter. The methods can be split into molecular (DNA analysis) and nonmolecular. Both molecular methods such as ribotyping, pulse-field gel electrophoresis, and randomly amplified polymorphic DNA, and non-molecular methods such as antibiotic resistance analysis (ARA), nutritional patterning, cell wall fatty acid analysis, and strain specific coliphages have been used (and published) in source tracking projects (3). ARA relies on different antibiotic resistance patterns that can be related to specific sources of fecal pollution. Benefits of ARA include use of simple laboratory techniques, basic equipment requirements, and can be performed at a relatively low cost compared to some other methods. In addition, the accuracy is comparable to molecular methods (2).
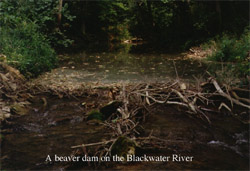
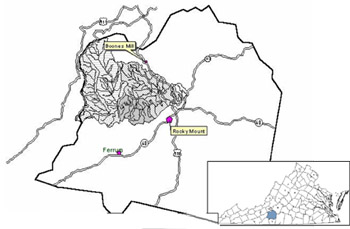
The goal of this study was to perform BST in the Blackwater River watershed, Franklin County, Va. The project objectives were (1) to build a library of fecal bacteria from known sources in the watershed, and (2) compare fecal bacteria from streams (unknown sources) against the library to determine the sources of the fecal bacteria.
| Study area | 28,463 ha (70,300 ac) |
| Population | 5,756 |
| Length of impaired segments | 180.2 km (112 mi) |
| Number of impaired segments | 4 |
| Land use | 65.1% forest, 31.1% agriculture, 3.8% urban |
| Other facts of interest | County has 2nd highest dairy population in VA County has 6th highest cattle population in VA Many homes on septic tank/drainfield Drains into Smith Mountain Lake Provides drinking water for town of Rocky Mount |
Procedure
Bacteria from thirteen sources were collected in Franklin County. These sources included dairy and beef cow, chicken, horse, goat, deer, raccoon, muskrat, goose, duck, coyote, wild turkey and human. Each bacterium was tested for growth on 31 antibiotic concentrations and either "growth" or "no growth" was recorded for each one. The figure below shows two of the 31 plates with bacteria growth, each with 48 bacterial cultures. This pattern of growth/no growth formed the antibiotic resistance profile, much like a bar code. Profiles of 1,451 bacteria were divided into human, livestock or wildlife categories, then combined to form the library. The correct classifications were obtained with a statistical program: 82.3% for human isolates, 86.2% for livestock and 87.4% for wildlife
Thirteen water quality monitoring sites were sampled periodically fromSeptember 1999 to April 2000. Fecal coliform and fecal enterococci counts were obtained and results were recorded as colony forming units (CFU) per 100 ml. Forty-eight bacterial cultures from each water sample were tested with the antibiotic plates (like those from fecal samples) to obtain a growth profile. This profile was compared to the known-source library to determine the source of that bacterium.
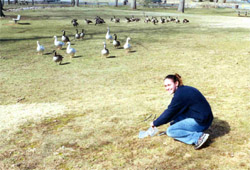 A student collecting goose droppings to obtain known-source fecal bacteria. |
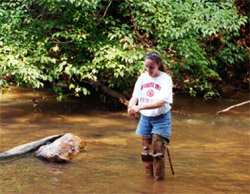 The author collecting a water sample in the Blackwater |
Results
Table 1 summarizes the fecal coliform counts for each month. In Virginia, a sample with more than 1000 fecal coliform bacteria per 100 ml of water is in violation of the water quality standard. A sample with less than 10 fecal coliforms per 100 ml of sample was placed into the low category. A sample with between 10 and 1000 fecal coliforms per 100 ml was moderate, and a sample with more than 1000 fecal coliforms per 100 milliliters was high. Of 131 samples taken during the study, 35, or 27% were in violation. Streams that consistently violate the standard (like the Blackwater and its tributaries) are placed on the impaired waters list by the Virginia DEQ. Streams on that list must have TMDL projects performed in order to be able to bring it into compliance with the standard.
| Month | No. of samples | Low | Moderate | High |
|---|---|---|---|---|
| September 1999 | 9 | 0 | 6 | 3 |
| October 1999 | 9 | 1 | 3 | 5 |
| December 1999 | 9 | 3 | 6 | 0 |
| March 2000 | 7 | 0 | 5 | 2 |
| August 2000 | 9 | 0 | 3 | 6 |
| October 2000 | 13 | 0 | 3 | 10 |
| November 2000 | 12 | 3 | 9 | 0 |
| December 2000 | 13 | 1 | 8 | 4 |
| January 2001 | 12 | 2 | 7 | 3 |
| February 2001 | 13 | 5 | 7 | 1 |
| March 2001 | 12 | 3 | 8 | 1 |
| April 2001 | 13 | 7 | 6 | 0 |
| Total | 131 | 25 | 71 | 35 |
The results from the BST portion of the project are summarized in Table 2. The 48 bacterial cultures from each water sample were placed into human, livestock, or wildlife categories. The category with the largest number of cultures was designated as the dominant category. The dominant category gives a generalized view of the sources of contamination. For example, in a sample with 48 cultures, 24, or 50% are livestock, 10, or 20% are human, and 14, or 30% are wildlife, the dominant category is livestock. Human, livestock and wildlife categories dominated the samples throughout the study. Livestock dominated 46.3% of the samples over the entire sampling period, followed by human at 30.5% and wildlife at 24.8%. Human cultures were found at each site at least once during the year, ranging from 0.0 to 85.0% of the sample isolates. The livestock signature varied from 2.3% to 100% and the wildlife signature varied from 0.0% to 79.5%.
| Month | No. of samples | Human | Livestock | Wildlife |
|---|---|---|---|---|
| September 1999 | 9 | 0 | 5 | 4 |
| October 1999 | 9 | 0 | 8 | 1 |
| December 1999 | 7 | 1 | 2 | 5 |
| March 2000 | 7 | 3 | 1 | 3 |
| August 2000 | 9 | 1 | 8 | 0 |
| October 2000 | 13 | 5 | 7 | 1 |
| November 2000 | 12 | 0 | 10 | 2 |
| December 2000a | 13 | 6 | 3 | 4 |
| January 2001b | 12 | 4 | 7 | 2 |
| February 2001 | 11 | 6 | 4 | 1 |
| March 2001 | 7 | 5 | 0 | 2 |
| April 2001 | 12 | 6 | 1 | 5 |
| Total | 121 | 37 | 56 | 30 |
| (Percentage) | (100%) | (30.5%) | (46.3%) | (24.8) |
| a One sample in December 1999 was split between wildlife and human. b One sample in January 2001 was split between wildlife and livestock. | ||||
 Summary
ARA has shown to be an effective tool in determining sources of fecal pollution in an impaired watershed. Samples from the Blackwater River were found to contain bacterial isolates from livestock, wildlife, and human sources in varying proportions throughout the sampling period. With the approximately even distribution among sources, all three source categories will require attention to improve water quality. This will be accomplished by developing and implementing best management practices (BMPs) to reduce fecal inputs. Reliable identification of fecal pollution sources will ensure that BMP efforts and costs are directed at the correct sources. A tool is now available for use in BMP planning and implementation. BST results can also be used to monitor the reductions and changes in the ratio of fecal bacteria from human, wildlife and livestock sources after BMPs are put into place.
For more information
Bacterial source tracking, see Dr. Charles Hagedorn's website http://www.bsi.vt.edu/biol_4684/BST/BST.html
Bacterial Source Tracking Methodology (BST): Update as of March 2001 in Crop and Soil Environmental News http://www.ext.vt.edu/news/periodicals/cses/2001-03/bst.html
EPA's Total maximum daily load (TMDL) program: http://www.epa.gov/owow/tmdl/
References
Visit Virginia Cooperative Extension