
You've reached the Virginia Cooperative Extension Newsletter Archive. These files cover more than ten years of newsletters posted on our old website (through April/May 2009), and are provided for historical purposes only. As such, they may contain out-of-date references and broken links.
To see our latest newsletters and current information, visit our website at http://www.ext.vt.edu/news/.
Newsletter Archive index: http://sites.ext.vt.edu/newsletter-archive/

A fluorometer from Turner Designs, Ltd (Model AU-10, Sunnyvale, CA) was evaluated and it performed well in both laboratory and field tests. The detector located fluorescent plumes in water samples taken in coastal rivers where a human signature had been identified based on microbial source-tracking (MST) results. Additionally, the detector correctly identified samples in controlled laboratory tests that had been spiked with detergents and/or septage. Samples without septage or detergents (or containing detergents without optical brighteners) failed to fluoresce. The instrument was then used successfully on a variety of waterways (marine, brackish, and fresh) where human sources of pollution were suspected or could be confirmed with MST methods. In larger bodies of water in Virginia and New York, fluorescent plumes could be identified with the fluorometer and then were traced back to the shore and directly to locations that appeared to be the source of the pollution. The fluorescent signals appeared to be stable over seasons, storage in refrigeration for at least four months, and over different water conditions. Whenever fluorescent plumes were found in bodies of water, MST also demonstrated a human signature in every case where MST was performed.

Figure 1. Typical scene on the Coan River. Potential sources of human contamination are not readily apparent, but avian source are.
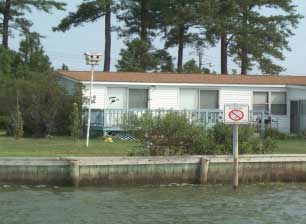
Figure 2. Waterfront home with adjacent water containing a condemned shellfish bed. The OWS for the home is located somewhere between the bulkhead and the back of the house.
Although MST indicated that human sources of pollution were a major contributor, there was no way for MST to provide any type of direction about where the human-origin fecal bacteria might be coming from. The fluorometry project was established to determine if OBs could be detected at the same locations where MST indicated that human sources of pollution were present (to cross-validate the MST results), and, if OBs were present, to see if there was any type of concentration gradient that might provide some direction towards specific locations where the human pollution originated (see Part I for details on fluorometry and detecting OBs).
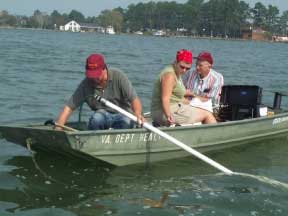
Figure 3. Using the fluorometer in continuous flow mode, where water flows through a submersible pump on the end of the PVC pipe, then through the instrument, and then exits the boat. Mike Saluta (left), Annie Hassall (center), and Ray Reneau (right).
The digital readout (can also be used with a recorder) ranges from -999 to +999, and for field use the approach was to calibrate the instrument as close to zero as possible with a water sample that was from the same body of water (river, stream, etc.) that was being evaluated at that time, and was from an area such as mid-channel where fluorescence was negliable. Calibration of samples for laboratory analysis was done in a similar manner; deionized water was used as a negative sample, while positive samples consisted of water to which small amounts of detergent were added (0.264 mL of Food Lion Clean Detergent with Bleach Alternative (liquid) added to 200 mL of tap water for a standard of 0.132% detergent). Once the instrument was calibrated to near zero, deionized water produced strong negative readings, and 10 to 20 mL of the detergent standard added to 1.0 L of tap water produced strong positive readings. Precise dilutions of the detergent or effluent from an experimental OWS provided positive readings that were almost linear over the concentration ranges studied (Figure 4). Prior to field evaluation, the instrument was tested successfully with several different types of samples. Solutions prepared from a wide range of commercial laundry detergents all fluoresced. Waters that were suspected not to have pollution from human sources (springs from a variety of rural locations and streams from remote areas of the Jefferson National Forest in Virginia) did not fluoresce. Waters with obvious pollution sources from wildlife or livestock (but not human) did not fluoresce. A commercial detergent that was advertised as containing no optical brighteners did not fluoresce, and samples from different wastewater treatment plants and experimental on-site systems all fluoresced.
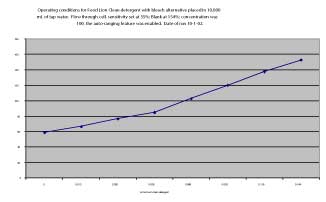
Figure 4. Standard calibration curve using Food Lion detergent.
Two important lessons were learned from the initial laboratory tests: first, the optical brightener "signature" survived both municipal and domestic wastewater treatment systems and could be detected at very dilute levels; second, the fluorometer could be accurately calibrated and concentrations of OB-containing compounds (detergents) yielded a nearly linear response. Based on the lab results, the fluorometer was deemed ready for field-testing in open waters.
B. Field Tests
Sampling Location: Coan River (Northumberland County, Va).
Based on MST results from the previous shellfish project where substantial fecal pollution from human sources was indicated (see Project Introduction), the same sampling sites on the two rivers were obvious locations to field-test the fluorometer. Water samples were collected from both rivers at various times over a several month period, and shoreline samples were collected from areas with developed shorelines (Figure 2), local marinas served by pit privies (Figure 5), areas with less dense housing (new homes), natural areas with no homes (Figure 1), and agricultural areas that comprised less desirable habitats for wildlife. Fecal bacteria (E. coli) were isolated from the water samples, and MST methodology was employed to determine if the fecal bacteria were human or non-human in origin. The samples were collected with boats provided and piloted by personnel from the Virginia Division of Shellfish Sanitation (DSS).
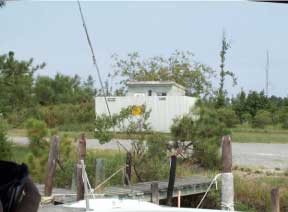
Figure 5. Unlined pit privy serving a private marina, Coan River, Va.
Many trips were made to test and evaluate the fluorometer under a variety of different conditions and locations; these resulted in several conclusions summarized as follows:
1. The initial field tests were performed around the shellfish beds at locations where DSS routinely collected water samples. These were also the same locations where the previous MST study had indicated that E. coli were predominantly of human-origin. The initial fluorometer tests were inconclusive as many of the shellfish beds were away from shore and located near or in the main channel. MST results continued to indicate that many of the E. coli from these samples were human in origin, but the fluorometer results were in the range of what was interpreted as negative results for OBs. Based on these results (data not shown), it was clear that sampling away from shore would not be productive, except for instrument calibration, so the decision was made to attempt to find OB concentrations adjacent to the shore.
2. At first, the background samples from the river channel were in the same range as the shoreline samples. However, the first samplings were performed on the high tide and it soon became apparent that this was not the best time to sample since high tidal waters would, to a large extent, block the movement of OWS contaminant plumes to the river. It became apparent further flourometer tests would need to be coordinated with low or outgoing tidal conditions.
3. The boats that DSS routinely used for sample collections were too large, moved too fast at idle speeds, and churned the water too much when attempting to sample close to shore (Figure 6), so a smaller boat was necessary. A flat-bottom boat that could be towed to areas of interest and then used to cruise slowly along shore lines with a battery-operated trolling motor to collect samples and test the fluorometer (Figure 3) worked very well.
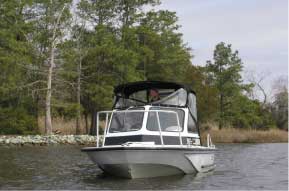
Figure 6. Division of Shellfish Sanitation (DSS) boat used to tow a smaller boat (Figure 3) to areas where the fluorometer was tested.
4. Subsequent field tests on the Coan River (flat-bottom boat, low tide, near shore) produced encouraging results (representative samples and results are shown in Table 1). The instrument was calibrated in the middle of the river channel where very low background levels were recorded (samples 1, 16, and 20, Table 1). Samples from homes of different ages and undeveloped areas showed no fluorescence (samples 2, 4, 7, 8 11, 14, and 15), while samples from near-bulkhead locations around older homes and samples from a cove with homes of different ages, a small marina, and a pit privy all demonstrated fluorescence (samples 3, 5, 6, 9, 10, 12, 13, and 17-19). The presence of the contaminants appeared to come from a single house located in the cove, and the pit privy did not appear to be the source of the contaminant plume at the time the samples were collected (samples 9 and 10). The fluorescence from the older homes was repeatable as high positive readings were obtained by returning to the same area (samples 12 and 13). The cove results were repeatable as well (samples 17-19), and the plume could be followed to one specific home where suds were visible on the water (sample 19). The MST results agreed with those from the fluorometer and indicated that a substantial human signature was present every time the fluorometer recorded an OB level of 89-90 and above (Table 1). No human signature was found in any samples where there was very low fluorescence.
The lessons from the field tests described above (items 1-4) indicated that there were situations, such as the shellfish beds in the river channel, where MST would indicate human-origin isolates but the OB test would be negative. On the other hand, wherever a positive OB test occurred, MST always indicated that human-origin isolates were present in substantial numbers. The search for OWS effluent plumes needed to be conducted on the outgoing tide (for tidal waters), and fluorescent plumes, once found, could be re-found on repeated attempts, and the plumes could be followed to exact locations on the shore where they appeared to originate. The next step was to repeat the field tests on other rivers in Virginia and in other locations outside Virginia to evaluate the applicability of OB detection in different environments from shellfish embayments adjacent to the Chesapeake Bay.
Table 1. Fluorometer and MST test results from field tests on rivers in Virginia.
| Sample No. | Units of Fluorescence | Site Description | Substaintial Human Signature Based on MST |
|---|---|---|---|
| Coan River | |||
| 1 | 17 | Background, calibration of instrument | --- |
| 2 | 22 | Small beach, older homes | No |
| 3 | 93 | Small marina, cove with privy | Yes |
| 4 | 46 | Long dock, older homes | No |
| 5 | 89 | Gray house, outbuildings, older homes | Yes |
| 6 | 90 | House with boat rack, older homes | Yes |
| 7 | 0 | Vacant lot, no home | No |
| 8 | 76 | Older homes | No |
| 9 | 198 | Homes in cove with privy | Yes |
| 10 | 253 | Homes in cove with privy | Yes |
| 11 | 14 | New home near marina | --- |
| 12 | 95 to 217 | Return to older homes | Yes |
| 13 | 331 | Shallow area near older homes | Yes |
| 14 | 7 | Undeveloped area | --- |
| 15 | 16 | Undeveloped area | No |
| 16 | 5 | Recalibration in middle of river | No |
| 17 | 150 | Mouth of privy cove | Yes |
| 18 | 243 | In privy cove | Yes |
| 19 | Over 300 | House in privy cove, suds visible on water | Yes |
| 20 | 5 | Out of privy cove, recalibration | --- |
| Little Wicomico River | |||
| 1 | 0 | Background, calibration of instrument | --- |
| 2 | 317 | Along bank, fully developed | Yes |
| 3 | 250 | Drainage way near older home | Yes |
| 4 | 305 | House without seawall | Yes |
| 5 | 100 to 200 | Sheltered cove, developed | Yes |
| 6 | 50 | Undeveloped wooded area | No |
| 7 | 70 | Undeveloped, algal bloom | No |
| Piankatank River | |||
| 1 | 7 | Background, calibration of instrument | --- |
| 2 | 11 | Everett's Creek, older homes | No |
| 3 | 102 | Drainage trench behind homes | Yes |
| 4 | 9 | House behind island | No |
| 5 | 96 | Single house, possible sewage eruption | Yes |
| 6 | 10 | New homes near community area | No |
| 7 | 5 | Dock with birds, new homes | No |
| 8 | 23 | New homes, background sample | No |
| 9 | 17 | Undeveloped area, marshy and wooded | --- |
| *--- indicates that MST was not performed; too few E. coli were recovered from samples. | |||
Sampling Location: Little Wicomico River (Northumberland County, Va).
The field test on the Little Wicomico River produced encouraging results that agreed with those from the final tests on the Coan River (Table 1). The samples were collected and the instrument tested on the outgoing tide, and the fluorometer was calibrated in the middle of the river channel, resulting in low background levels (sample 1). Areas along the shore that were fully developed with homes of different ages, docks, and a wide variety of boats all yielded substantial fluorescent signals (samples 2 to 5), but two undeveloped areas did not fluoresce (samples 6 and 7). All samples were positive for E. coli. MST was performed on six of the samples, and the results agreed with those from the fluorometer (Table 1). No human signature was found with two samples where there was low fluorescence (samples 6 and 7), and a human signature was found for four samples that demonstrated fluorescence (samples 2-5). Substantial algal growth was present at all locations and caused some instability in the fluorometer, as the readings for the calibration varied from -20 to +50. These background values did not interfere with the identification of fluorescence since relative changes above background were detected as positive readings after calibration.
Sampling Location: Piankatank River (Gloucester County, Va).
A field test on the Piankatank River produced encouraging results that agreed with those from the final tests on the Coan and Little Wicomico Rivers (Table 1). The field test was done on the outgoing tide, and the instrument was calibrated in the middle of the river channel, resulting in low background levels (sample 1). Samples from newer homes and undeveloped areas showed no fluorescence above background (samples 2, 4, and 6-9), while samples from near-shore locations around older homes and samples from a cove with older homes, and one served by a drainage ditch all demonstrated fluorescence (samples 3 and 5). MST was performed on seven of the samples and the results agreed with those from the fluorometer (Table 1). No human signature was found with five samples where there was low fluorescence (samples 2, 4, and 6-8), and a human signature was found for two samples that demonstrated fluorescence (samples 3 and 5).
Water Chemistry and Fluorometer Results.
To determine if water chemistry parameters had any relationship to OB detection, analyses were performed for nitrate, ammonia, phosphate, and total suspended solids for the final Coan River samples and in the Little Wicomico and Piankatank River samples. None of the water chemistry results indicated a water quality problem, and all values were within acceptable levels for good water quality (data not shown). There was also no apparent connection between water chemistry values and the fluorometer readings. Since all of the water quality values were low, there were no high readings that corresponded to high fluorometer values at any of the sites where water chemistry was performed.
Sampling Location: Huntington Beach, Ca.
As part of a separate source-tracking project funded by the Southern Coastal California Water Research Project (SCCWRP) and the EPA, twenty-four water matrix samples (12 salt, 8 fresh, 4 humic acids) were sent to the Virginia Tech lab for testing an MST protocol. Seven of the 24 samples had treated sewage added, and 4 of the 7 samples containing sewage were 100% sewage (by volume) while 2 samples had sewage added at 1%, and 1 sample had sewage added at 4% (Table 2). The samples were sent in October of 2002, but were not tested with the fluorometer until February of 2003. Those to which sewage had been added demonstrated fluorescence (in bold, Table 2), and those without sewage did not, and there was a concentration difference as the 100% sewage samples had fluorometer readings of over +100. These results demonstrated that optical brightener signals from sewage lasted at least four months in samples stored under refrigeration, the fluorometer could detect samples to which only 1% sewage had been added, and the fluorometer could differentiate between additions of small and large concentrations of sewage (Table 2).
Table 2. February 2003 samples, SCCWRP MST study.
| Sample No. | Units of Fluorescence | % Sewage Added to Sample in Ca. |
|---|---|---|
| A | 330 | 100 |
| B | 8 | 0 |
| C | -14 | 0 |
| D | 11 | 0 |
| E | 8 | 0 |
| G | 3 | 0 |
| H | 16 | 0 |
| I | 5 | 0 |
| J | 70 | 1 |
| K | 140 | 100 |
| L | -2 | 0 |
| M | 4 | 0 |
| N | 74 | 4 |
| O | 12 | 0 |
| P | -6 | 0 |
| Q | 30 | 1 |
| R | 260 | 100 |
| S | -5 | 0 |
| V | -5 | 0 |
| W | 235 | 100 |
| X | 7 | 0 |
Sampling Location: Washington, D.C. Area.
A separate MST project was performed on the Potomac River, Anacostia River, and Rock Creek under sponsorship of the Washington D.C. Metropolitan Council of Governments. Due to problems with combined sewer overflows, MST had demonstrated that human signatures were common in most of the samples that were collected monthly. There were numerous combined sewer overflows (CSOs) in February as a result of precipitation and snowmelt, and a distinct sewage odor was prevalent on the Anacostia River when the samples were collected. The February samples from all three water-bodies were examined with the fluorometer, and all fluoresced (Table 2). The highest fluorometer readings occurred with the Anacostia samples and lower Rock Creek, but all samples were positive. The fluorometer results confirmed the human signature results obtained from MST, and demonstrated the utility of the fluorometer, where the presence (or absence) of a human signature could be obtained instantly, as compared to two weeks or more for MST results. Since there was no water sample from D.C. that had no fluorescent signal, it was necessary to use deionized water to calibrate the instrument (Table 3). Rock Creek was the first entirely freshwater stream that was tested for OBs. There was no fluorescence in samples collected in later months when there were no CSOs for the Potomac River and Rock Creek, but the Anacostia almost always had high OB levels.
Table 3. February 2003 samples, Washington, D.C. project.
| Sample No. | Units of Fluorescence | Site Description | Substantial Human Signature based on MST |
|---|---|---|---|
| Blank | -21 | Deionized water | --- |
| 1 | 175 | Anacostia, DC/MD line | Yes |
| 2 | 86 | Anacostia, Bennig Rd. | Yes |
| 3 | 143 | Anacostia, Penn. Ave. | Yes |
| 4 | 125 | Anacostia, 11th St. | Yes |
| 5 | 139 | Anacostia, S. Capitol St. | Yes |
| 6 | 122 | Anacostia, Hains Pt. | Yes |
| 7 | 75 | Potomac, 3 Sisters | Yes |
| 8 | 82 | Potomac, Rock Creek | Yes |
| 9 | 46 | Potomac, Memorial Bridge | Yes |
| 10 | 25 | Rock Creek, DC/MD line | Yes |
| 11 | 74 | Rock Creek, Tilden St. | Yes |
| 12 | 80 | Rock Creek, Porter St. | Yes |
| 13 | 93 | Rock Creek, National Zoo | Yes |
| 14 | 113 | Rock Creek, Mass. Ave. | Yes |
| 15 | 105 | Rock Creek, Penn. Ave. | Yes |
Sampling Location: Long Island, NY.
A cooperative Sea Grant project with the Cornell University Marine Environmental Learning Center provided the opportunity to test the fluorometer outside Virginia in a totally different environment (Figure 7).
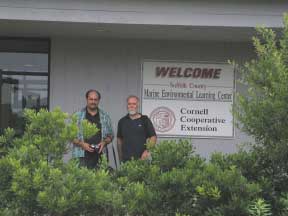
Figure 7. Cornell Marine Learning Center, Southhold, NY. Charles Hagedorn (Virginia Tech) on the left and Emerson Hasbrouck (Cornell) on the right.
Suffolk County, comprising the eastern half of Long Island, contains over 100,000 homes still served by an OWS system on the property. The Sea Grant program funded a two year project to perform MST on coastal embayments in an attempt to determine where fecal pollution was originating from, as 100% of the shellfish beds in Long Island waters are closed to harvest due to contamination, primarily from fecal bacteria. Results from MST (pulsed-field gel electrophoresis, or PFGE, on E. coli) indicted that substantial percentages of the E. coli from some sampling areas were human in origin. These results provided the perfect opportunity to test the fluorometer in Long Island waters at those same locations.

Figure 8. Older homes with waterfront property in eastern long Island. Each small home is served by an OWS system located on the property.
Many of the shoreline residences were older homes with an OWS somewhere on the property (Figure 8). Many of these homes were originally built, and the OWS sized, as seasonal residences but are now occupied all year.
The approach was the same as in Virginia, samples were collected and the instrument tested on the outgoing tide, and the fluorometer was calibrated well away from the shore, resulting in low background levels (Figure 9). Although a flat-bottom boat was not available, the boat that was used did perform satisfactorily, but not as well as the flat-bottom boat used in Virginia. The boat did not have a trolling motor and tended to move too fast even at the slowest speed, and also tended to stir up the sediments with prop wash (Figure 9). Even with these difficulties, the results were the same as those observed in Virginia (data not shown). Areas that showed high levels of fluorescence were found at those locations where MST indicated human-derived pollution around older homes (Figure 8), and fluorescent plumes were observed on the falling tide that lead directly back to shore and pointed towards a specific home or group of homes. Natural areas and the waterfronts around newer residences were negative for fluorescence, and the plumes found around older homes could readily be detected again after leaving and then returning to the area. The tests in New York waters off Long Island confirmed the approach that had been developed and tested in Virginia waters adjacent to the Chesapeake Bay.
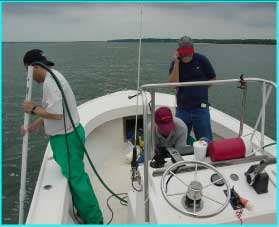
Figure 9. Calibrating the fluorometer away from shore on Long Island waters. The individuals are Scott Wagemann (left), Mike Saluta (center), and Emerson Hasbrouck (right).
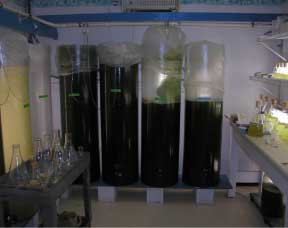
Figure 10. Cultures of marine algae grown as a food source for the Learning Center's shellfish rearing facility.
The Sea Grant project also provided an unexpected opportunity. The Center is a major shellfish rearing facility, and several different pure cultures of marine algae are cultivated to feed the shellfish (Figure 10). Samples of the algae were collected and tested for fluorescence and none of them fluoresced at the same wavelengths as OBs. Even after samples of the algae were allowed to die and the decomposition products tested over time, there was no fluorescence from the algal species tested that would interfere with fluorescence from OBs.
While MST has met with reasonable success in determining the sources of fecal contamination, it is not feasible in most cases to expect MST to be able to identify specific sites that are the origin of human signatures. Fluorescence offers the potential for locating specific sites where fecal contaminants may be entering the water body under consideration. This should allow individual problem sites to be located and remediation to be performed. The use of fluorescence in such situations is potentially a low-cost way of reducing the human contribution to the pollution load in these waters.
The fluorometer will be very valuable as an aid in deciding where to sample on large bodies of water, especially lakes and coastal areas. The fluorometer can either be used in the field where water can be pumped through it via continuous flow, or it can be set up for discrete samples (with a cuvette holder attached to the instrument). Large numbers of samples can be tested for fluorescence very quickly, and the results can be critical in deciding where the most appropriate places to concentrate sampling on large bodies of water are located. Due to lab costs and method difficulties, it is not feasible to analyze such large sample numbers with microbiology-based MST methods. The fluorometer should fill an important role in future source-tracking efforts as it can be used as a "screening" method for human-derived sources. For those samples that contain no human sources of pollution, MST can then be performed more economically and efficiently if only wildlife and livestock (or dog or bird) sources need to be identified.
There appears to be justification for considering the soils associated with water bodies being studied for fluorescence. The Coan River, where we were most successful at identifying sources of fluorescence, was at a lower elevation, and the soils are shallower than for the Little Wicomico River. There may also be an interaction between the age of the homes and the water table depth in the soils where the homes are located. Fewer fluorescent plumes were found around homes that were located on deeper soils. As fluorescence technology emerges as a source-tracking tool, it would be very valuable to study how well fluorescence is removed in soils over short distances when the soil is saturated or near saturation. Such information would be very helpful in making decisions regarding where to sample for fluorescence in water bodies and how to interpret fluorescence after it has been found.
The project investigators would like to thank the staff and management of the Virginia Division of Shellfish Sanitation, Virginia Department of Health, for providing boats, assistance, and resources during this project. Their willingness to accommodate schedules and needs, and to go out on the water in all types of weather to test the fluorometer, is what made this project a success.
Visit Virginia Cooperative Extension