
You've reached the Virginia Cooperative Extension Newsletter Archive. These files cover more than ten years of newsletters posted on our old website (through April/May 2009), and are provided for historical purposes only. As such, they may contain out-of-date references and broken links.
To see our latest newsletters and current information, visit our website at http://www.ext.vt.edu/news/.
Newsletter Archive index: http://sites.ext.vt.edu/newsletter-archive/

Essential plant nutrients are required for economic and sustainable crop
production. Manufactured fertilizers are the major source of nutrients for
agronomic cropping systems. Fertilizers are global commodities and the price and
availability are influenced by factors throughout the world. The United States is a
major producer of phosphate fertilizers but imports most of the potash needs and
half of N fertilizer requirements. Growth in the economies of China and India, in
particular, as well as other countries has created a greater worldwide demand for
fertilizers, and increased use of corn for ethanol production is increasing fertilizer
demand in the United States due to expected increases in corn acres. World
production capacity for N and P fertilizers is slightly greater than demand while
potash capacity is significantly greater than demand, but production has been
constrained by several factors in recent years. Adequate supplies of fertilizers
appear to be available in the world market, but logistical challenges exist for
nitrogen and potash in particular. Growers should be advised to determine their
needs as soon as possible and work with their dealers to develop deliveries and
prices that can be managed in their production programs.
Due to prices of fertilizer nutrients in 2007, the cost of over-fertilization is greater than at any time in the recent past. However, lost yield due to underfertilization is also at record levels due to the value of wheat and corn. Sample and test soils in each field to accurately determine lime, P and K needed to achieve optimum yields and maintain soil fertility. Nitrogen management is especially critical. Select the most appropriate N rate for each field based on soil productivity and split apply N to obtain the most efficient use of each pound of N. For corn production, starter band N applications of 40-50 lbs N/acre applied in a 2x2 band followed by sidedress N applications is the most efficient approach to N applications.
Essential nutrient elements must be provided for cropping systems that produce
profitable yields and maintain soil fertility levels for sustainable production. While
nutrients may be supplied in many forms, i.e. livestock manures, green manure crops and
composts, manufactured fertilizers comprise the largest nutrient source in most
agronomic crop production systems. The availability, cost, and efficient use of these
nutrients are a major management challenge for farmers and advisers.
Manufactured fertilizers (N, P, K) are global commodities and are traded much like grain. Their availability and cost are affected by supply and demand situations on a worldwide basis. While the United States is a major producer and exporter of phosphorus fertilizers, our agricultural industry imports nitrogen and potash fertilizers. Nitrogen fertilizers come from many areas of the world where lower natural gas prices make manufacturing of N fertilizers such as urea and UAN solution more profitable than in North America. The United States does not have large reserves of potash, so imports of potash are necessary, and come mainly from Canada.
The International Fertilizer Industry Association (IFA) recently published their annual “World Agriculture and Fertilizer Demand” report for 2006-2007. The complete report can be accessed at http://www.fertilizer.org/ifa/publicat/PDF/2006_council_benos_aires_2006_ifa_summary.pdf This paper highlights some of their findings and what it means for our producers in 2007.
Fertilizer demand is driven by the need to produce food, fiber and energy, and the ability to pay for the fertilizer. World gross domestic product and its change in various areas of the world indicate where money is likely to be available to pay for fertilizers. Table 1 shows that gross domestic product grew at the rate of 10 and 8.3% for China and India, respectively, in 2006 and is predicted to be similar in 2007 with only a 1% decrease for India. These countries have large populations and now have money to pay for fertilizers to increase total food production as well as to increase the amount of meat and milk available to consumers.
2003 |
2004 |
2005 |
2006 |
2007 |
|
| World | 4.0 |
5.3 |
4.9 |
5.1 |
4.9 |
| China | 9.5 |
10.1 |
10.2 |
10.0 |
10.0 |
| USA | 2.7 |
3.9 |
3.2 |
3.4 |
2.9 |
| India | 7.4 |
8.0 |
8.5 |
8.3 |
7.3 |
| Euro area | 0.7 |
2.1 |
1.3 |
2.4 |
2.0 |
| Brazil | 0.5 |
4.9 |
2.3 |
3.6 |
4.0 |
| Russia | 7.3 |
7.2 |
6.4 |
6.5 |
6.5 |
World biofuel production is increasing with large increases occurring in the United States. Ethanol production capacity in the US is estimated to be approximately 4.5 billion gallons per year, with more capacity forecast Corn is the major feedstock for ethanol production in the United States (http://www.ethanolrfa.org/industry/statistics/).
The combination of world demand for grain, increased demand for grain to produce ethanol in the United States, and drought reduced harvests in Australia has resulted in a decrease in the grain stocks to use ratio. The grain stocks to use ratio is at the lowest point for the past 10 years (Fig. 1). As a result grain prices in the United States and the world have moved higher in recent months.
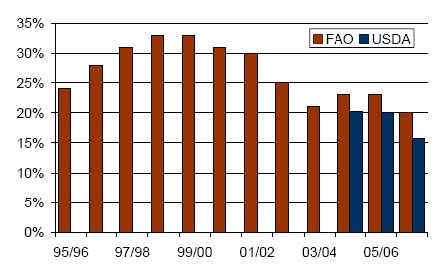
Fig. 1. Grain stocks to use ratio from 1995 to 2006 as estimated by the Food and
Agriculture Organization (FAO) of the United Nations and USDA. (From International
Fertilizer Industry Association World Agriculture and Fertilizer Demand Summary
Report 2006-2007).
The International Fertilizer Industry Association fertilizer consumption and percent change forecasts are shown in Table 2. The forecasts are based on world GDP growth, grain prices, and historic trends. Increased consumption of all nutrients is forecasted for the 2006-2007 fertilizer year as opposed to decreases in P and K consumption that occurred in the 2005-2006 fertilizer year.
| N | P2O5 | K2O | Total | |
| Year | Million tons of Nutrients and %change |
|||
| 2004/2005 | 90.3 |
37.0 |
26.0 |
153.4 |
| 2005/2006e* | 91.3 |
36.5 |
25.2 |
153.1 |
| change | +1.1% |
-1.3 |
-3.2% |
-0.2% |
| 2006/2007f | 95.2 |
38.4 |
26.4 |
160.0 |
| change | +4.2% |
+5.0% |
+4.7% |
+4.5% |
| 2007/2008f | 97.7 |
39.6 |
27.4 |
164.7 |
| change | +2.6% |
+3.3% |
+4.1% |
+3.0% |
*e = estimated, f = forecast
Nitrogen is the nutrient of most concern to producers on wheat, corn, cotton, and grass pastures. Urea is the most widely traded N source in the world and global urea supply and demand for 2005-2007 are shown in Figure 3. While effective supply is greater than effective demand, the margin of excess is only 1%, which explains some of the recent rapid increases in urea supply on the world and US markets.
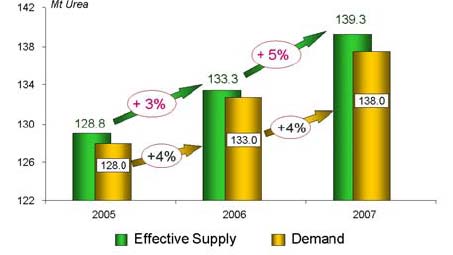
Figure 3. Global urea supply and demand for 2005-2007 (Source, IFA Global Fertilizer
Supply Demand Summary Report, December 2006; Mt = million tons)
Demand for phosphoric acid for fertilizer manufacture in the world increased at a slower
rate than demand during the period 2004-2006 and a similar situation is forecast for 2007
(Figure 4). Production capacity only slightly exceeds demand for 2007.
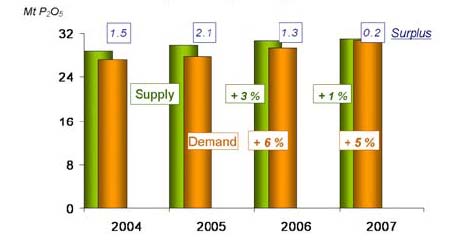
Figure 4. World phosphoric acid for fertilizers supply demand for 2004-2007 (Source:
IFA Global Fertilizer Demand Summary Report, December 2006; Mt = million tons).
World potash supply and demand represents a different situation as shown in Figure 5. Forecast available supply exceeds demand for 2007 by about 20%, which means adequate available potash; however, increased transportation costs from Canada have increased potash costs in recent years. In addition, companies have reduced production at certain times to reduce inventories.
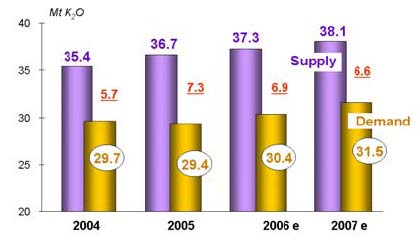
Figure 5. World potash supply demand for 2004-2007 (Source: IFA Global Fertilizer
Demand Summary Report, December 2006; Mt = million tons).
Fertilizer prices have moved higher since December mainly on the basis of higher wheat and corn prices, and higher anticipated demand associated with increased corn acres in the United States, i.e. 3 to 8 million acres depending on numerous factors. World fertilizer demand is up, again due to higher world grain prices and the funds available in other countries to bid for fertilizer. There is little reason to believe that these prices will decrease in the short term unless one is willing to bet that a lot of corn acres will not be planted in the United States.
While world fertilizer production capacity is adequate to cover demand, we in the U.S are dependent on imports of nitrogen and potash and thus have to consider transportation delays and costs. For these reasons, it is advisable to determine fertilizer needs as soon as possible and check with dealers about deliveries and costs so as to be able to secure needed supplies in a timely manner at a cost that can be managed in the crop production budget.
Determining fertilizer needs: Soil testing each field is essential to determine P and K needs. Soil pH levels should be adjusted to 6.0 to 6.2 to maximize the efficiency of nutrient utilization. Band applications of P in starter fertilizers for corn production can also increase efficiency of utilization as compared to broadcast applications. Overall, balanced fertilization with optimum N, P, and K applied based on soil test data will be the most efficient fertilizer program.
Maximum efficiency of N fertilizer use in wheat can be obtained with the fertilizer N rate split between tillering (growth stage (GS) 25) and the beginning of stem elongation (GS 30). Fertilizer N use efficiency is maximized in corn by applying a starter band of 40 to 50 lbs N/acre in a 2 x 2 placement with needed P, with the remainder of the N applied as a sidedress application at GS V6-V8. The other important aspect for N use efficiency is determining the appropriate N rate needed for each field. This decision should be made by determining the productivity potential of each field based on historic yields. N applications should be highest on the most productive fields and lower on less productive fields.
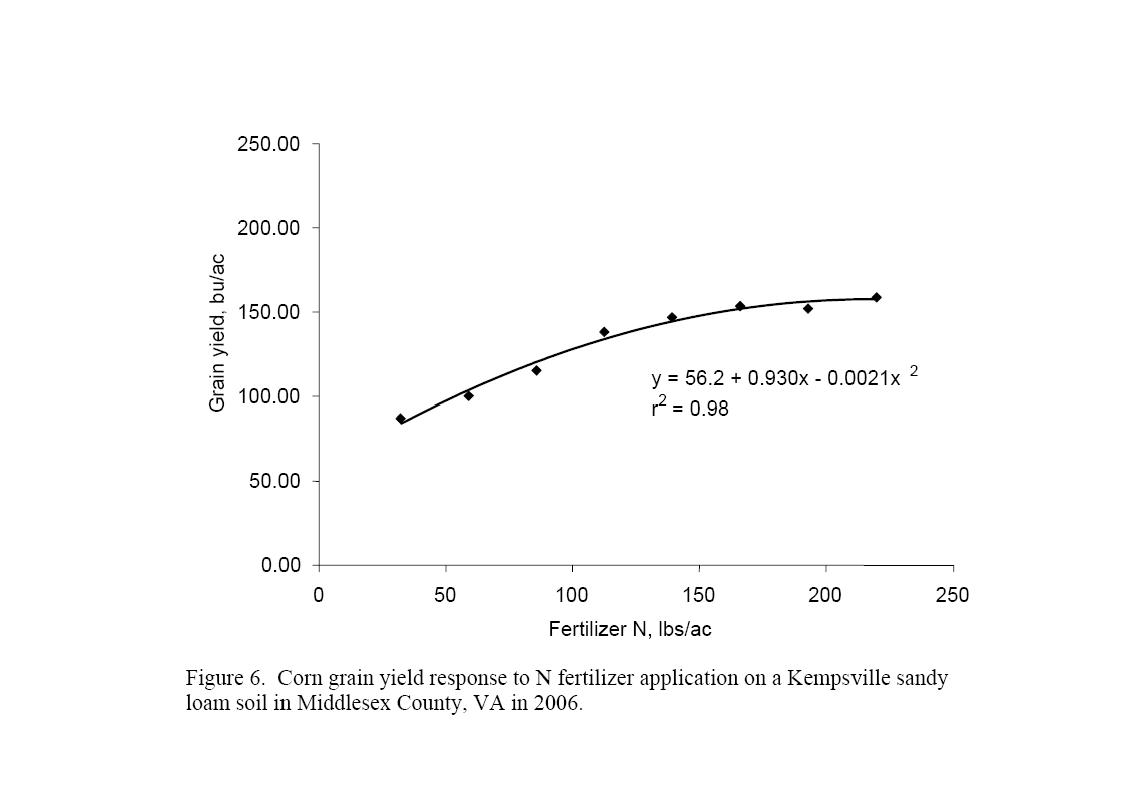
Should fertilizer N rates be reduced due to high cost of N? Corn yield increases due to N fertilizer applications decrease as grain yields approach a maximum in the field. A typical response curve is shown in Figure 6. The maximum corn yield obtained at the site in Figure 6 was predicted to be 154 bu/acre and would have required 221 lbs N/acre. However, looking at the grain yield response curve, we can calculate that 150 lbs N/acre produced 149 bu/acre. The last 5 bu/acre of yield required 71 lbs of N. With corn valued at $3.40/bu and N costing $0.40/lb, for example, it would cost $28.40 for a yield increase valued at $17.00; it is not wise to fertilize for maximum yield. However, even though these are historically expensive N prices, it does pay to fertilize to reach near maximum yield. Application of 150 lbs N/acre at this site produced 97% of maximum yield, and certainly is quite economical using approximately 1.0 N per bushel of yield (150 lbs N for a 149 bu/acre yield). This is also an environmental sound application rate.
The major question for growers is “how much risk do I wish to take?” Trying to fertilize to the point where the last amount of yield increase equals the cost of the fertilizer N is difficult, if not impossible, as variable weather and pests have a large effect on yield potential. The application of fertilizer N to reach maximum yield will likely result in excessive N being applied in many years. This is not economically sound, and it creates the potential for environmental contamination of ground and surface waters. The situation is that we are only able to calculate these exact N rates by having a range of rates in the field and looking back on the season.
So what should growers do? First, estimate the yield potential for each field based on soil series and yield history. This should be a realistic yield that excludes the exceptional drought years. Second, determine if the field is likely to respond to N fertilizer applications. Fields that receive manure or biosolids, or those corn crops following a strong alfalfa stand and/or long-term pasture may not need N fertilizer, or may require a reduced rate. Give the proper credits to the organic and/or residual N sources and utilize the Pre-sidedress Soil Nitrate Test or tissue testing to determine supplemental N needs. Third, select the proper N fertilizer rate for each field. Our research in 2006 over 13 N fertilizer responsive sites showed that optimum N rates were 1.07 lbs N/bu of yield (range of 0.7 to 1.4 lbs N/bu) for a split application of starter N and sidedress N applications. Yields ranged from 122 to 212 bu/acre.
N fertilization in 2007 is truly a time to “get it right.” The cost of overfertilization
is greater than at any time in the recent past due to the high cost of N
fertilizers. However, lost yield due to under-fertilization is also at record levels due to
the value of wheat and corn. Selecting the most appropriate N rate for each field and
split applying N to obtain the most efficient use of each pound of N is the approach to
producing economic corn and wheat yields in 2007.
In summary, soil test and apply needed lime, P and K. Select appropriate N rates for each field and split apply for both wheat and corn. Starter-band N applications for corn will increase the efficiency of early season N and insure that the crop has adequate N until side-dressing. Yield potentials can be assessed at that time and N rates adjusted for each field.
1 W. G. Wysor Professor and Graduate Research Assistant, respectively.
Visit Virginia Cooperative Extension