
You've reached the Virginia Cooperative Extension Newsletter Archive. These files cover more than ten years of newsletters posted on our old website (through April/May 2009), and are provided for historical purposes only. As such, they may contain out-of-date references and broken links.
To see our latest newsletters and current information, visit our website at http://www.ext.vt.edu/news/.
Newsletter Archive index: http://sites.ext.vt.edu/newsletter-archive/
Changes in Farm Numbers from the 1997 Census of Agriculture
Farm Business Management Update, August 1999
By Jim Pease of the Department of Agricultural and Applied Economics, Virginia Tech
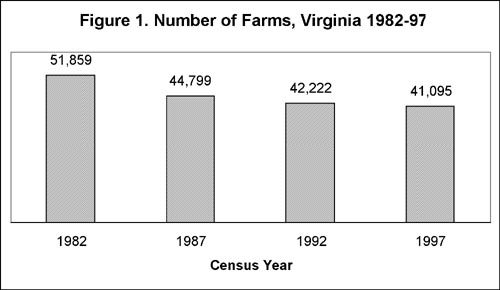
The 1997 Census of Agriculture indicates that Virginia has 41,095 farms, a decline of 1,127 farms or 2.7 percent from the 1992 Census. Although this loss may seem like quite a few farms, the decline is smaller in relative and absolute terms than any Census since 1982. Figure 1 shows the number of Virginia farms throughout the 1982-1997 agricultural censuses. Over the whole period 1982 to 1997, Virginia has lost on average more than 700 farms per year. However, from 1992 to 1997, the Commonwealth lost somewhat more than 200 farms per year. Although Virginia farm losses were not large in historical terms, the relative loss of farms still exceeded the U.S. average. U.S. farm numbers declined by only 13,441 farms, or 0.7 percent from 1992-97.
Changes in farm numbers by county varied widely across the state. Higher farm losses are shown in darker colors on the accompanying map. In general, counties in the Southwest, Southside, and Southeast regions suffered the highest relative losses. Consolidation or disappearance of small farm operations, primarily tobacco farms, was the principal cause of farm losses in Southwest and Southside. Farm losses in Southeast and other counties along the I-95 Corridor are likely to be associated with the impacts of rapid urbanization in these areas. Counties which suffered 10 percent or more loss in farms included many which are among Virginia's highest-ranking counties in terms of value of agricultural production. Southampton (number 5), Pittsylvania (number 6), and Washington (number 8) are among this group.
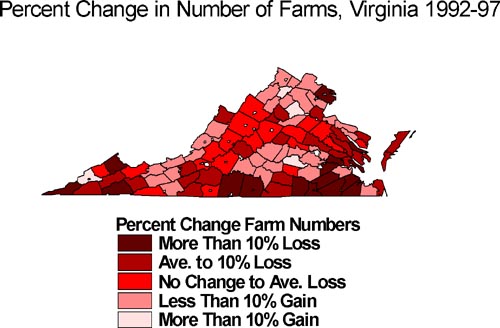
Table 1 shows the number and relative change in farm numbers by Extension District. Central and Northeast districts lost farms at a rate approximately equal to the state average. Northwest district, which produces a large proportion of the state's agricultural products, was relatively unchanged. Northern district shows a small increase of 139 farms or 2.1 percent. The districts experiencing greatest losses were Southwest and Southeast. The former district lost farms at more than twice the state average and accounts for more than two-thirds of state net farm losses. Washington County in Southwest lost 242 farms, more than any other county. Although Southeast district has only 6 percent of the Commonwealth's farms and the net loss of farms represents only 192 farms, Southeast farms are generally much larger than the average Virginia farm and agriculture represents a critical non-urban land use for the region.
Table 1. Farms and Percent Change by Extension District 1992-97
| Extension District | Farms 1997 | Change 1992-97 (%) |
|---|---|---|
| Central | 9,244 | -3.2 |
| Northeast | 2,559 | -3.0 |
| Northern | 6,759 | 2.1 |
| Northwest | 8,024 | 0.8 |
| Southeast | 2,320 | -7.7 |
| Southwest | 12,189 | -5.8 |
| State | 41,095 | -2.7 |
Table 2 shows the number and relative change in farm numbers by Planning District. Among Planning Districts that increased farms are Piedmont (PD14), Northern Virginia (PD8), Rappahanock-Rapidan (PD9), and Lord Fairfax (PD7). Further analysis is required to determine the types of new farms added in these Planning Districts between 1992-97. Relatively large losses in farm numbers can be observed in Penninsula (PD21), Southeastern Virginia (PD20), Lenowisco (PD1), and Southside (PD13). In general, farm number changes by Planning District follow the same pattern as observed by Extension District: the Southwest, Southside, and Southeast regions of the Virginia lost relatively more farms than other regions.
Table 2. Farms and Percent Change by Planning District 1992-97
| Planning District Number | Planning District Name | Farms 1997 | Change 1992-97 (%) |
|---|---|---|---|
| 1 | Lenowisco | 2,643 | -10.4 |
| 2 | Cumberland Plateau | 1,686 | -6.5 |
| 3 | Mount Rogers | 5,365 | -4.9 |
| 4 | New River Valley | 1,959 | -1.7 |
| 5 | Fifth | 1,114 | 0.9 |
| 6 | Central Shenandoah | 4,376 | -1.4 |
| 7 | Lord Fairfax | 2,534 | 4.9 |
| 8 | Northern Virginia | 1,415 | 4.5 |
| 9 | Rappahannock-Rapidan | 2,672 | 4.1 |
| 10 | Thomas Jefferson | 1,943 | -1.3 |
| 11 | Central Virginia | 2,578 | -1.2 |
| 12 | West Piedmont | 2,949 | -6.9 |
| 13 | Southside | 1,838 | -9.2 |
| 14 | Piedmont | 2,415 | 4.8 |
| 15 | Richmond Regional | 1,374 | -1.9 |
| 16 | Radco | 729 | -0.3 |
| 17 | Northern Neck | 491 | 0.8 |
| 18 | Middle Penninsula | 597 | -5.8 |
| 19 | Crater | 867 | -5.7 |
| 20 | Southeastern Virginia | 1,033 | -10.5 |
| 21 | Penninsula | 97 | -16.4 |
| 22 | Accomack-Northampton | 420 | -4.8 |
Contact the author at peasej@vt.edu .
Visit Virginia Cooperative Extension