You've reached the Virginia Cooperative Extension Newsletter Archive. These files cover more than ten years of newsletters posted on our old website (through April/May 2009), and are provided for historical purposes only. As such, they may contain out-of-date references and broken links.
To see our latest newsletters and current information, visit our website at http://www.ext.vt.edu/news/.
Newsletter Archive index: http://sites.ext.vt.edu/newsletter-archive/

Changes in Virginia Farm Acreage from the 1997 Census of Agriculture
Farm Business Management Update, October 1999
By Jim Pease
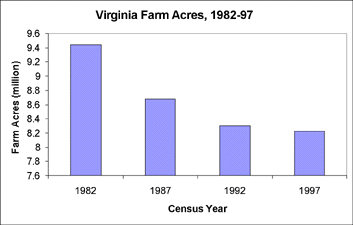
Virginia farm acreage decreased by 68,785 acres (-1 percent) from 1992 to 1997, a slower rate of decline than between other census periods. Figure 1 shows acres across all land uses on Virginia farms from 1982 to 1997, and the rate of decline is down substantially from 1982-87 (-8 percent) and 1987-92 (-4 percent). Nevertheless, approximately 14,000 acres per year left agricultural land uses from 1992-97. The Census of Agriculture, unfortunately, gives no clues as to the new land use of acreage leaving agriculture.

Across Extension Districts and their constituent Planning Districts, the change in farm acreage varies considerably. Table 1 shows 1997 farm acreage by Extension District and the percentage change since 1992. Central, Northeast, and Southwest Districts lost farm acreage at about the same pace as the state average. Southeast District had a smaller percentage drop than the state average, but Northwest District stood alone in increasing farm acreage by 0.7 percent (slightly over 9,000 acres). Northern District lost 47,412 acres (-3.2 percent), by far the largest absolute and proportionate loss.
|
Extension District |
1997 |
% Change 1992-97 |
|
Central |
2,019,675 |
-0.6 |
|
Northeast |
634,638 |
-0.7 |
|
Northern |
1,435,295 |
-3.2 |
|
Northwest |
1,407,027 |
0.7 |
|
Southeast |
908,249 |
-0.3 |
|
Southwest |
3,745,260 |
-0.7 |
|
State |
8,228,226 |
-0.8 |
Table 2 shows the same information broken out by Planning District (PD). The four PDs making up the Northern District (Northern Virginia, Rappahanock-Rapidan, Thomas Jefferson, and Radco) each lost at least 5,000 acres from farm use. Thomas Jefferson PD alone lost 21,000 acres from farm use. Within that PD, Albemarle County lost more than 16,000 acres (-8.7 percent), equivalent to 24 percent of the total state acreage lost from agricultural land use. Loudon County, in the Northern Virginia PD, lost about 10,500 acres (-5.4 percent), or 2,100 acres per year from 1992-97. Other PDs with unusually large percentage losses include West Piedmont (-7.4 percent), Penninsula (-9.1 percent), and Cumberland Plateau (-4.9 percent). In the West Piedmont Planning District, Pittsylvania County lost 30,185 farm acres (10.2 percent). Virginia Beach in the Southeastern Virginia PD lost more than 13,000 acres (-30.9 percent) of farm acres. Washington County in the Mount Rogers PD lost over 11,500 acres (-6.1 percent), equivalent to 58 average-sized farms in that county.
Some PDs and counties increased farm acreage by a significant proportion. Piedmont PD gained 37,618 acres (+7.1 percent), Lord Fairfax gained 15,121 acres (+3.8 percent), and Accomack-Northampton gained 4,850 acres (+3.4 percent). Among counties with unusually large increases in farm acreage, Charlotte (Piedmont PD) gained 18,643 acres (+16.5 percent), and Bath (Central Shenandoah PD) gained 11,261 acres (24 percent). As noted at the beginning of this article, the Census does not indicate either the prior use of county land now occupied in agricultural uses, nor does it indicate the fate of land lost from Virginia farms.
|
Planning District |
1997 |
% Change, 1992-97 |
|
Central Virginia |
504,980 |
0.2 |
|
West Piedmont |
548,234 |
-7.4 |
|
Southside |
473,800 |
-2.4 |
|
Piedmont |
566,851 |
7.1 |
|
Richmond Regional |
251,024 |
0.1 |
|
Northern Neck |
154,352 |
-1.2 |
|
Middle Penninsula |
218,425 |
-0.8 |
|
Penninsula |
10,837 |
-9.1 |
|
Northern Virginia |
233,237 |
-4.5 |
|
Rappahanock-Rapidan |
627,572 |
-1.7 |
|
Thomas Jefferson |
417,060 |
-4.8 |
|
Radco |
157,426 |
-3.1 |
|
Fifth |
193,937 |
0.5 |
|
Central Shenandoah |
802,284 |
-0.9 |
|
Lord Fairfax |
410,806 |
3.8 |
|
Crater |
318,989 |
-0.8 |
|
Southeastern Virginia |
440,373 |
-1.1 |
|
Accomack-Northampton |
148,887 |
3.4 |
|
Lenowisco |
281,114 |
1.6 |
|
Cumberland Plateau |
293,015 |
-4.9 |
|
Mount Rogers |
773,066 |
0.1 |
|
New River |
363,338 |
0.8 |
Contact the author at peasej@vt.edu .
Visit Virginia Cooperative Extension