
You've reached the Virginia Cooperative Extension Newsletter Archive. These files cover more than ten years of newsletters posted on our old website (through April/May 2009), and are provided for historical purposes only. As such, they may contain out-of-date references and broken links.
To see our latest newsletters and current information, visit our website at http://www.ext.vt.edu/news/.
Newsletter Archive index: http://sites.ext.vt.edu/newsletter-archive/
Economic Impact of Developing a Pricing Plan Extension Program
Farm Business Management Update, April 2001
By Dave Kenyon
During January and February 1998, two three-day workshops were presented to grain producers at Holland and Tappahannock, Virginia. The participating farmers came from fourteen different counties and cities in Southeast and Northern Neck regions of Virginia. During the first day, producers were taught how to forward price using cash contracts and futures. During the second day, the mechanics and strategies for trading options were discussed. During the third day, producers were shown how to develop a pricing plan for their 1998 corn and soybean crops. The plans provided specific price targets, percent of production to price, and recommendations for timing. Each producer left the workshop with a written marketing plan. Each day involved five hours of instruction, exercises, and discussion.
In February and March of 1999, the 53 grain producer participants were sent a questionnaire concerning the workshop and their experiences implementing the pricing plan. Twenty-three producer questionnaires were returned. All 23 of these producers had written pricing plans based on the information presented, and fourteen had tried to implement the plan. The average acres and yields of the 23 producers are in Table 1.
Table 1. Acres and Yields of Questionnaire Respondents
| Crop | Acres | Yield (bu.) | Production (bu.) |
|---|---|---|---|
| Corn | 305 | 105 | 32,025 |
| Wheat | 325 | 55 | 17,875 |
| Soybeans (Full) | 189 | 30 | 5,670 |
| Soybeans (Double Crop) | 359 | 26 | 9,334 |
| Total | 997 | N/A | 64,904 |
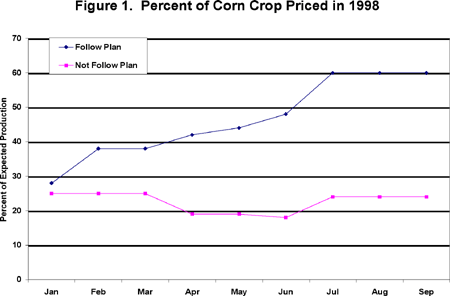
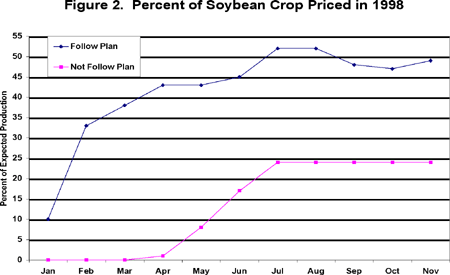
Each producer was asked what percent of expected production was priced each month from January 1998 until harvest (figures 1 and 2). In general, producers who followed their pricing plans forward priced over twice as much of expected production as those who did not follow their plans.
The benefit of following the plan was calculated in the following manner. The average futures price for each month was calculated and adjusted for the average basis from 1993-1997 to obtain a cash price estimate. For each group of producers, the number of bushels sold each month was multiplied by the cash price. All grain not sold before harvest was priced at the harvest price.
Producers who implemented the corn pricing plans received $2.45 a bushel compared to $2.24 for those who did not (Table 2). The $0.21 bushel price increase was worth, on average, an additional $6,597 per farm. Soybean producers who implemented their plans averaged $6.07 a bushel, or $0.32 more per bushel than those who did not. The pricing strategy increased soybean returns an average of $4,833 per farm. Together, the corn and soybean pricing strategies improved farm returns by $11,430 per farm. The 14 farmers who followed their plans increased their farm revenue by a total of $160,020.
Table 2. Impact of Corn and Soybean Pricing Plan on Farm Revenue: 1998
| Average price ($/bu) | Revenue ($/farm) |
|
| Corn (32,025 bu) | ||
| _Tried to implement plan | 2.45 | $78,321 |
| _Did not implement plan | 2.24 | $71,724 |
| _Difference | 0.21 | $6,597 |
| Soybeans (15,004 bu) | ||
| _Tried to implement plan | 6.07 | $91,111 |
| _Did not implement plan | 5.75 | $86,278 |
| _Difference | 0.32 | $4,833 |
If non-respondents attending the workshops behaved like respondents, 61 percent or 32 producers attempted to implement their pricing plans. On 32 farms, the aggregate increase in farm revenue would have been $365,760.
During the winter months of 1998, 1999, and 2000, pricing plans were presented to over 1,100 producers in Virginia, North Carolina, and South Carolina. Given the plans presented and corn and soybean prices in 1998, 1999, and 2000, producers who followed the pricing plans presented would have achieved similar price improvements as those experienced in 1998. If 61 percent of those producers improved returns by an average of $11,430 per farm, the value of this pricing and risk management information was worth between $500,000 and $750,000. These estimates for 1999 and 2000 are not based on survey results, but they are believed to be conservative estimates of the value of the Developing a Pricing Plan workshop and price outlook presentations in 1998, 1999, and 2000.
Source: Brian Jenkins, Tools and Techniques for Managing Risk for Virginia Grain and Oilseed Producers, M.S. thesis, April 2001.
Contact the author at dkenyon@vt.edu
Visit Virginia Cooperative Extension