
You've reached the Virginia Cooperative Extension Newsletter Archive. These files cover more than ten years of newsletters posted on our old website (through April/May 2009), and are provided for historical purposes only. As such, they may contain out-of-date references and broken links.
To see our latest newsletters and current information, visit our website at http://www.ext.vt.edu/news/.
Newsletter Archive index: http://sites.ext.vt.edu/newsletter-archive/
Timing Loan Deficiency Payments
Farm Business Management Update, June 2002
By Dave Kenyon

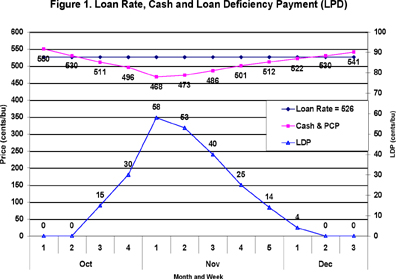
Under the 1996 and 2002 Farm Bills, wheat, corn, and soybean producers are eligible for loan deficiency payments (LDP). The LDP is the difference between the county loan rate and the posted county price (PCP) when the PCP is below the loan rate. The PCP is designed to track local cash prices although PCP and cash prices are sometimes different. The key decision for producers is when to take the LDP. The maximum LDP occurs when cash prices are at their lowest level. Once the LDP decision is made, it cannot be reversed. If prices move lower after taking the LDP, the producer loses the potential for a larger LDP. Hence, the producer needs to anticipate when the lowest cash price of the season is going to occur to maximize the LDP.
posted county price (PCP) when the PCP is below the loan rate. The PCP is designed to track local cash prices although PCP and cash prices are sometimes different. The key decision for producers is when to take the LDP. The maximum LDP occurs when cash prices are at their lowest level. Once the LDP decision is made, it cannot be reversed. If prices move lower after taking the LDP, the producer loses the potential for a larger LDP. Hence, the producer needs to anticipate when the lowest cash price of the season is going to occur to maximize the LDP.
Loan deficiency payments are very important to Virginia wheat, corn, and soybean producers. During 1999-2001, LDP totaled $20-30 million dollars each year. For wheat, corn, and soybeans, the average LDP were equal to 21, 11, and 24 percent respectively, of season average price in 1999-2001 (Table 1).
| Loan Deficiency Payment | |||||
|---|---|---|---|---|---|
| Item | Production | Total Quantity | Total Payment | Average Payment | Average Price |
| Units | 1,000 bu | 1,000 bu | 1,000 $ | $/bu | $/bu |
| Wheat | |||||
| 1999 | 13,680 | 10,928 | 6,193 | 0.57 | 2.00 |
| 2000 | 12,915 | 10,008 | 4,120 | 0.40 | 2.00 |
| 2001 | 10,200 | 7,737 | 3,005 | 0.39 | 2.30 |
| Corn | |||||
| 1999 | 21,840 | 24,594 | 5,516 | 0.22 | 2.15 |
| 2000 | 48,180 | 41,437 | 13,167 | 0.32 | 2.00 |
| 2001 | 40,590 | 33,130 | 5,371 | 0.16 | 2.10 |
| Soybeans | |||||
| 1999 | 11,800 | 9,697 | 9,221 | 0.95 | 4.50 |
| 2000 | 18,480 | 14,704 | 13,278 | 0.90 | 4.35 |
| 2001 | 17,280 | 13,668 | 17,866 | 1.31 | 4.05 |
The objective of this paper is to give producers information that will help them determine when the lowest cash price for the season will occur so they can maximize their LDP. It is impossible to predict exactly when the lowest cash price will occur each year, but analysis of historical prices should improve the probability that producers will select a cash price near the seasonal low price.
Weekly prices for major markets for corn, soybeans, and wheat are analyzed. Local cash prices in major production areas should follow the seasonal price pattern of these markets, although the level may be slightly lower or higher. But in terms of timing, the low price should occur at the same time period in most Virginia markets.
For each commodity, the historical low price week from 1980-2000 is first determined. Then the low prices surrounding the low price week for the last four years when LDP were paid are analyzed. Some observations relevant to each commodity are made to help producers determine the low price week.
Wheat
Historically, the low average price of wheat occurs during the first two weeks of July (Figure 1). From 1980-2000, the low price each season has occurred between the second week of June and the fourth week of August. During 1998-2001, the low prices occurred during the same time period (Table 2). Over both time periods, there is another low price period in August. These low prices are associated with selling wheat before the corn harvest begins. Most wheat in Virginia is harvested by the end of the second week in July. Selling wheat in August requires storage. Since the lows in August are at comparable prices to July, selling in July without incurring storage costs would yield a higher net price in terms of timing the LDP.
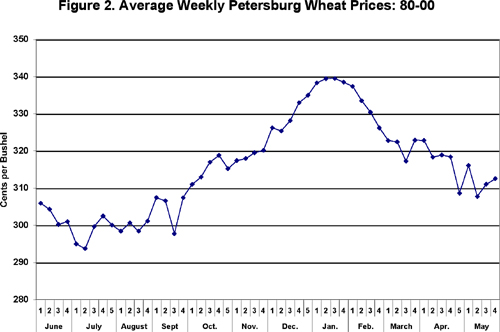
For 1998 to 2001, if a producer had chosen the low price week each year, the average low price would have been 190 cents. In comparison, taking the LDP the first or second week of July each year would have resulted in an average price of 203-204 cents. Taking the LDP outside the low price period would have resulted in an average price of 209 cents or more, reducing the LDP by up to 19 cents per bushel.
Table 2. Petersburg Harvest Wheat Prices: 1998-2001
| Month | Week | 1998 | 1999 | 2000 | 2001 | 98-01 Average |
|---|---|---|---|---|---|---|
| June | 1 | 235 | 211 | 216 | 231 | 223 |
| 2 | 234 | 210 | 215 | 224 | 221 | |
| 3 | 244 | 208 | 203 | 206 | 215 | |
| 4 | 237 | 204 | 212 | 206 | 215 | |
| July | 1 | 223 | 191 | 189 | 208 | 203 |
| 2 | 229 | 186 | 185 | 214 | 204 | |
| 3 | 232 | 185 | 189 | 237 | 211 | |
| 4 | 223 | 210 | 187 | 233 | 213 | |
| 5 | 206 | 211 | 188 | 230 | 209 | |
| August | 1 | 205 | 211 | 181 | 215 | 203 |
| 2 | 213 | 226 | 177 | 220 | 209 | |
| 3 | 202 | 210 | 179 | 217 | 202 | |
| 4 | 191 | 212 | 182 | 234 | 205 |
Additional analysis to help select the low price week did not result in any consistently reliable indicators. In general, low prices occur earlier when the harvest season is proceeding quickly compared to normal. Each week USDA releases a Weekly Weather and Crop Bulletin during June and July indicating what percentage of the crop is harvested, compared to the same week the previous five years. In addition, if the June World Agricultural Supply and Demand Estimates (WASDE) show U.S. ending stocks will be declining substantially during the upcoming marketing year, the low price will come earlier in the harvest period.
Corn
The harvest low price for corn has historically occurred the first week of October at 240 cents (Figure 2). Harvest prices between the fourth week of September and the last week of October have averaged 242 cents. Hence, there is a six-week period of low prices during this period. Fourteen of the twenty low prices since 1980 have occurred in this six-week period.
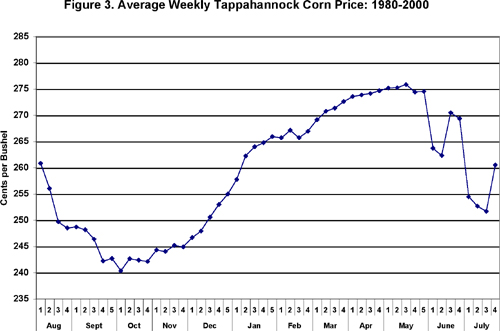
During 1998-2001, low harvest prices occurred during the same six-week period (Table 3). Prices during the last four years were 40-50 cents lower than the averages of 1980-2000. The difference in weekly average prices during the six-week low period is only 1-3 cents per bushel. However, each year the low price during this six week period could change by as much as 15-20 cents per bushel.
Table 3. Tappahannock Harvest Corn Prices: 1998-2001
| Month | Week | 1998 | 1999 | 2000 | 2001 | 98-01 Average |
|---|---|---|---|---|---|---|
| Aug | 1 | 223 | 213 | 169 | 216 | 205 |
| 2 | 226 | 235 | 165 | 227 | 213 | |
| 3 | 222 | 220 | 167 | 218 | 207 | |
| 4 | 219 | 222 | 174 | 218 | 208 | |
| Sept | 1 | 202 | 216 | 183 | 214 | 204 |
| 2 | 206 | 223 | 181 | 209 | 205 | |
| 3 | 206 | 218 | 172 | 202 | 200 | |
| 4 | 203 | 210 | 174 | 192 | 195 | |
| 5 | 209 | 209 | 175 | 184 | 194 | |
| Oct | 1 | 205 | 205 | 178 | 185 | 193 |
| 2 | 220 | 199 | 178 | 178 | 194 | |
| 3 | 224 | 199 | 176 | 172 | 193 | |
| 4 | 217 | 200 | 172 | 177 | 192 | |
| Nov | 1 | 219 | 200 | 183 | 175 | 194 |
| 2 | 214 | 201 | 181 | 185 | 195 | |
| 3 | 219 | 195 | 179 | 203 | 199 | |
| 4 | 222 | 193 | 179 | 203 | 199 |
If a producer picked the low price each year during 1998-2001, the average low price would be 185 cents. The average low price for the first week of October was 193 cents. Hence, perfect forecasting of the low price would have increased the average LDP by 8 cents per bushel. Hence, the average LDP does not seem to be very sensitive to the week chosen during the six-week low price harvest period.
Soybeans
The lowest average price occurs the first week of October (Figure 3). This low price is associated with the Midwest soybean harvest since the Virginia harvest does not start until the second or third week of October. Historically, only 20 percent of Virginia soybeans are harvested by the end of the third week of October. Eighty percent of Virginia soybeans are harvested by Thanksgiving.
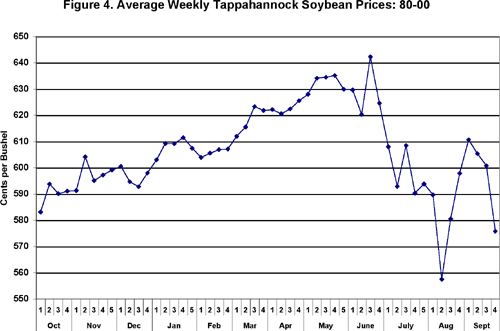
Virginia low prices on average occur the last two weeks of October and the first week of November. The lows during these three weeks occurred at an average price of 590 during 1980-2001. During 1998-2001, the lows occurred during the same weeks, but the average low was 458 cents per bushel (Table 4). With perfect foresight, a producer picking the low price each year from 1998-2001 would have averaged 443 per bushel, thus increasing the LDP by 15 cents per bushel. No consistently reliable indicators could be found to indicate when the low price week would occur each year. In general, a slower harvest pace and increased ending stock projectors result in the low price coming later in the season.
Table 4. Tappahannock Harvest Soybean Prices: 1998-2001
| Month | Week | 1998 | 1999 | 2000 | 2001 | 98-01 Average |
|---|---|---|---|---|---|---|
| Oct | 1 | 516 | 459 | 466 | 426 | 467 |
| 2 | 562 | 472 | 460 | 423 | 479 | |
| 3 | 553 | 472 | 437 | 409 | 468 | |
| 4 | 544 | 453 | 441 | 394 | 458 | |
| Nov | 1 | 554 | 451 | 427 | 398 | 458 |
| 2 | 556 | 453 | 440 | 402 | 463 | |
| 3 | 563 | 436 | 432 | 408 | 460 | |
| 4 | 555 | 440 | 444 | 409 | 462 | |
| 5 | 563 | 446 | 453 | 413 | 469 | |
| Dec | 1 | 571 | 457 | 460 | 420 | 477 |
| 2 | 548 | 441 | 468 | 414 | 468 | |
| 3 | 546 | 448 | 463 | 414 | 468 |
A secondary low occurs the second and third week of December. Although this low occurs at slightly higher prices (3-10 cents), the producer would not lose much of the potential LDP during these two weeks. The secondary low in Virginia is caused by harvest of late planted double crop soybeans.
Over the last seven years, South American soybean production has been increasing dramatically. In 2003, South America will probably produce more soybeans than the U.S. Since the S.A. harvest is in April-June, it is possible that U.S. prices may be lower in the spring than at harvest. However, these lower prices would require storage. Hence, the "best" time to take the LDP will continue to be during the harvest period.
In general, the "best" time to take the LDP payment is the second week of July for wheat, the first week of October for corn, and the third and fourth weeks of October for soybeans. The low price each year will not necessarily occur during these weeks, but historically the average price has been lowest at these times.
Contact the author at dkenyon@vt.edu
Visit Virginia Cooperative Extension