
You've reached the Virginia Cooperative Extension Newsletter Archive. These files cover more than ten years of newsletters posted on our old website (through April/May 2009), and are provided for historical purposes only. As such, they may contain out-of-date references and broken links.
To see our latest newsletters and current information, visit our website at http://www.ext.vt.edu/news/.
Newsletter Archive index: http://sites.ext.vt.edu/newsletter-archive/
Can I Make Money Farming?
Farm Business Management Update, October/November 2005
By Keith Dickinson, (Keith.Dickinson@vt.edu), Extension Agent, Farm Business Management, Northern District

One of the most common questions by random folks calling local extension offices these days always seems to begin with the phrase "I just bought X (number) acres of land..." This initial phrase is followed with several options such as
"... and it has a pond on it, and I don't how to manage it."
"... and I want to find someone to farm it for me."
"... and I'd like to create a horse pasture on it."
Any of the above statements / requests for information is pretty easy to handle. The one that makes most Extension Agents cringe is the one that goes something like this:
"...and I want to become a farmer... and I'd like to make $50,000 per year doing it... and I can spend up to 15 or 20 hours a week working on the farm... and I need half the acreage for my house, my horse pasture, and half the rest is wooded."
For a variety of reasons, it seems that folks with wide-eyed dreams of a simpler lifestyle, are moving to the more rural places in the Northern Piedmont of Virginia and buying pieces of land.
Table 1: Average Net Cash Income for Farm Operations and Operators in N. Piedmont Region
| County | Net Cash Income Per Farm (Operations1) | Net Cash Income Per Farm (Operators2) |
|---|---|---|
| Albemarle | -$2006 | -$1,818 |
| Culpeper | $7115 | $7,571 |
| Fauquier | -$2126 | -$3,995 |
| Fluvanna | -$1098 | -$2,656 |
| Greene | $7835 | $6,234 |
| Loudoun | $3123 | $3,592 |
| Louisa | $2609 | -$179 |
| Madison | $2964 | $2,242 |
| Nelson | -$312 | $53 |
| Orange | $15,041 | $11,129 |
| Rappahannock | -$2,985 | -$2,837 |
| Source: 2002 United States Census of Agriculture | ||
| 1Net cash farm income of the operations. This concept is derived by subtracting total farm and farm related expenses from total sales, government payments, and other farm-related income. Net cash farm income of the operation includes the value of commodities produced under contract by the contract growers. For publication purposes, farms are divided into two categories: 1. Farms with net gains (includes those operations that broke even) and 2. Farms with net losses. | ||
| 2Net cash farm income of the operators. This value is the operators' total revenue (fees for producing under contract, total sales not under contract, government payments, and farm-related income) minus total expenses paid by the operators. Net cash farm income of the operator removes the value of contract commodities produced and acknowledges the income the operators received for services performed for the contractor. Net cash farm income of the operators is a new concept for the 2002 census. For publication purposes, farms are divided into two categories: 1. Farms with net gains (includes those operations that broke even) and 2. Farms with net losses. | ||
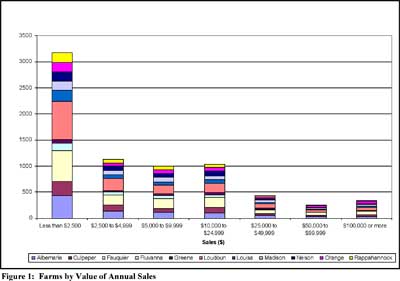
Unfortunately, these people are often quite disappointed when reality sets in. Farming is not a business with abundant profit opportunities, particularly on a small scale. According to the most recent U.S. Census of Agriculture, about two-thirds of the farm operations and individual farm operators in the Northern Piedmont Region have an annual net loss (Tables 1-3), and the vast majority of farms in the region have annual sales of less than $10,000 (Figure 1).
Table 2: Average Net Gains and Average Net Losses of Farms Operations in N. Piedmont Region
| County | Farms with Net Gains | Average Income per Farm: Farms with Net Gains | Farms with Net Losses | Average Loss per Farm: Farms with Net Losses | ||
|---|---|---|---|---|---|---|
| Number | Percent | $ | Number | Percent | $ | |
| Albemarle | 285 | 31 | 17,121 | 632 | 69 | 10,631 |
| Culpeper | 237 | 35 | 38,527 | 431 | 65 | 10,158 |
| Fauquier | 414 | 31 | 23,758 | 923 | 69 | 13,737 |
| Fluvanna | 99 | 30 | 14,115 | 230 | 70 | 7,646 |
| Greene | 116 | 54 | 18,229 | 99 | 46 | 4,344 |
| Loudoun | 616 | 41 | 26,815 | 901 | 59 | 13,075 |
| Louisa | 165 | 35 | 26,339 | 310 | 65 | 10,022 |
| Madison | 211 | 40 | 21,468 | 321 | 60 | 9,199 |
| Nelson | 164 | 36 | 9,331 | 293 | 64 | 5,710 |
| Orange | 209 | 43 | 54,629 | 282 | 57 | 14,299 |
| Rappahannock | 157 | 36 | 11,021 | 285 | 64 | 10,700 |
| Source: 2002 United States Census of Agriculture | ||||||
Table 3: Average Net Gains and Average Net Losses of Farms Operators in N. Piedmont Region
| County | Farm Operators with Net Gains | Average Income per Operator: Operators with Net Gains | Farm Operators with Net Losses | Average Loss per Operator: Operators with Net Losses | ||
|---|---|---|---|---|---|---|
| Number | Percent | $ | Number | Percent | $ | |
| Albemarle | 301 | 33 | 16,429 | 616 | 67 | 10,734 |
| Culpeper | 238 | 36 | 39,568 | 430 | 64 | 10,139 |
| Fauquier | 426 | 32 | 17,026 | 911 | 68 | 13,825 |
| Fluvanna | 99 | 30 | 9,034 | 230 | 70 | 7,688 |
| Greene | 118 | 55 | 14,891 | 97 | 45 | 4,297 |
| Loudoun | 643 | 42 | 26,835 | 874 | 58 | 13,508 |
| Louisa | 183 | 39 | 16,583 | 292 | 61 | 10,684 |
| Madison | 211 | 40 | 19,640 | 321 | 60 | 9,195 |
| Nelson | 183 | 40 | 8,952 | 274 | 60 | 5,890 |
| Orange | 208 | 42 | 46,673 | 283 | 58 | 14,996 |
| Rappahannock | 170 | 38 | 10,516 | 272 | 62 | 11,184 |
| Source: 2002 United States Census of Agriculture | ||||||
While opportunities in small scale agricultural operations can provide a rural landowner some "back to nature" experiences as well as a modest income, they generally require a great deal of hard work, skill, and investment of time, labor, and capital. The opportunities that provide a consistently high income (>$25,000 / year) are rare. That magical enterprise that can provide a profit of several thousand dollars per acre with little up front investment, no experience, and with little labor requirements simply does not exist.
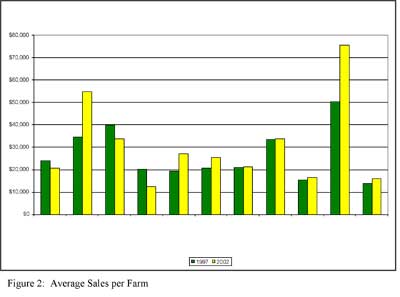
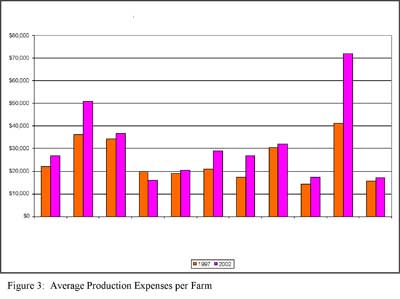
Some may ask why so many farms in this region are losing money. Several factors contribute to this issue; however, an easy trend to spot is that sales per farm for most counties in this region have not increased significantly, while the cost of production has increased (Figures 2 and 3).
There are, of course, exceptions to every trend, which can be seen when reviewing the trends in the previous tables and figures for Culpeper and Orange counties. These two counties show a higher average net income than surrounding counties and have had a significant increase in the average sales per farm. These trends can be directly attributed to the influence of a handful of large greenhouse and nursery operations that have been established in these counties recently. Before everyone draws the conclusion that starting a greenhouse business is "the answer," be sure to take a close look at Figure 3. While these two counties showed a substantial increase in sales, it should be noticed that they also showed a substantial increase in cost of production. One should also note in tables 2 and 3 that these two counties have the same relative breakdown on the percentage of farms with gains and losses.
Questions that a rural landowner needs to ask before considering an agricultural enterprise include
If landowners can spend time thinking over and even answering a majority of these questions, an extension agent or farm consultant could help guide them through the process of choosing a direction for the management of their land. Landowners need to be realistic in their expectations for what they can do with their land and what sort of income it will provide. If farming was a high return industry, more than 2 percent of our nation's population would be involved in it!
Visit Virginia Cooperative Extension